
By Jack Sun · Updated October 12, 2026
Quick definition
Particle size describes size under a stated measurement method. Particle size distribution (PSD) describes the proportions of different sizes on a specified number, volume or mass basis. In a cumulative undersize distribution, D10, D50 and D90 identify the sizes at 10%, 50% and 90%. D50 is a median on that basis, not a universal arithmetic mean. [1]
A single particle dimension, a PM air-particle category and a distribution percentile are different types of information. This reference connects micron scales and distribution reading without assigning a filter grade from size alone.
1. Micron size chart: nm, μm and mm
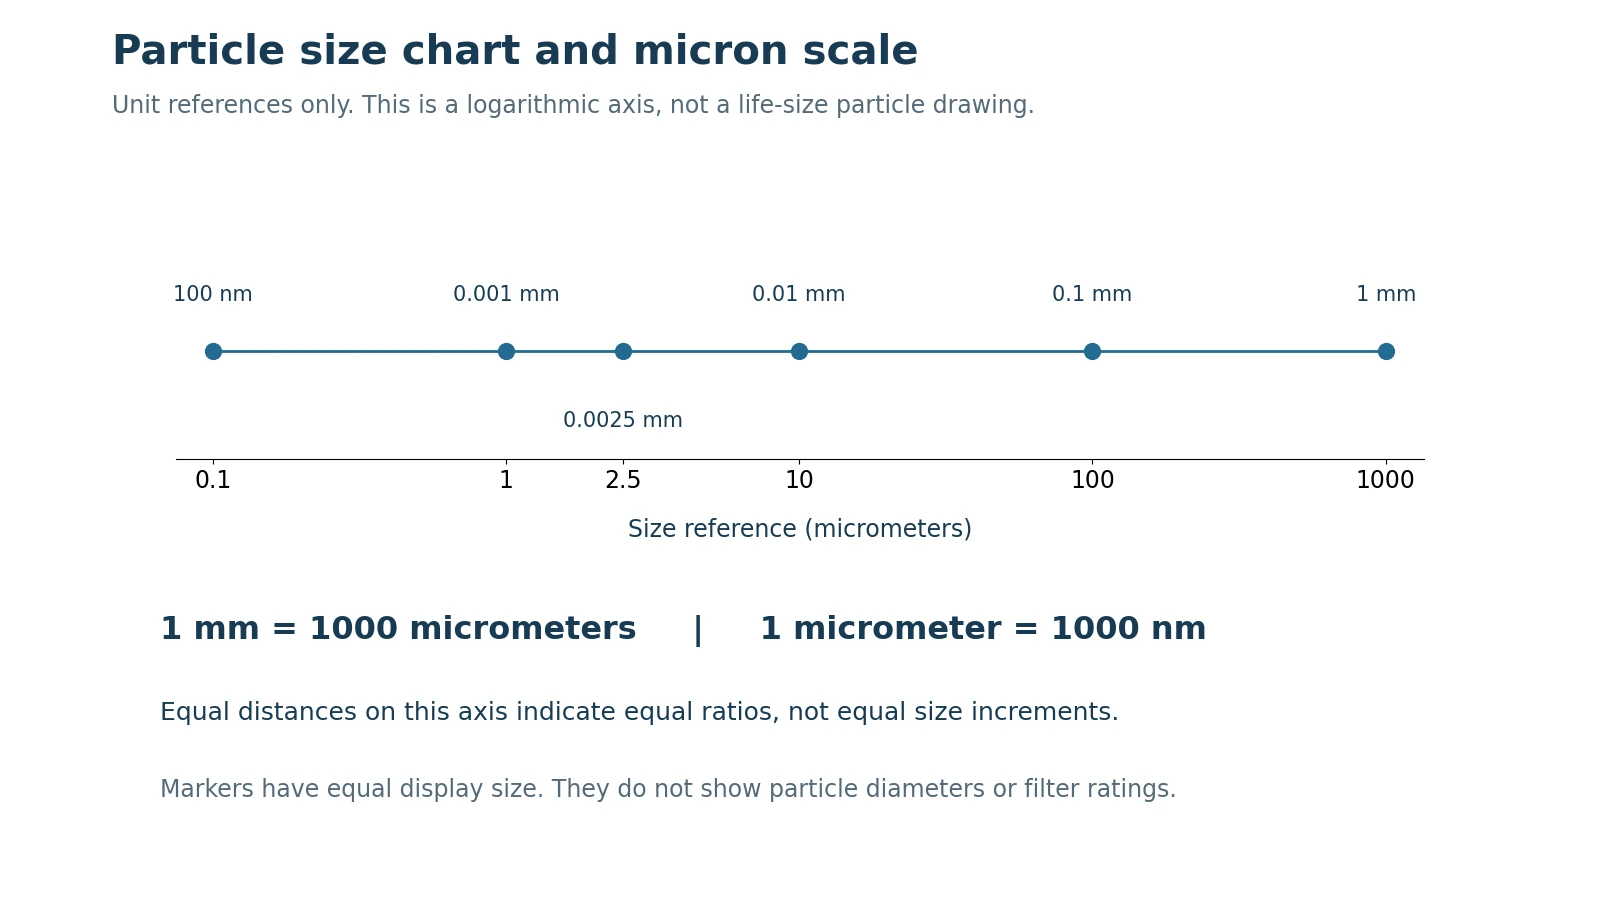
Micron is a common name for micrometer or micrometre, symbol μm. SI prefixes give 1 mm = 1000 μm and 1 μm = 1000 nm. [2]
| Reference | mm | μm | nm |
|---|---|---|---|
| 0.1 μm | 0.0001 | 0.1 | 100 |
| 1 μm | 0.001 | 1 | 1000 |
| 2.5 μm | 0.0025 | 2.5 | 2500 |
| 10 μm | 0.01 | 10 | 10000 |
| 100 μm | 0.1 | 100 | 100000 |
| 1000 μm | 1 | 1000 | 1000000 |
These are exact unit conversions, not product or contaminant ranges. Size in μm must also be distinguished from mass concentration in μg/m³.
2. Reading a particle size chart
Unit charts permit direct conversion. Charts of actual objects or classifications need a definition and source.
| Object or category | Reference size | Basis and limitation |
|---|---|---|
| PM2.5 | Generally 2.5 μm and smaller | EPA air-particle category; not one fixed size or a filter grade [3] |
| PM10 | Generally 10 μm and smaller | Includes finer particles; not only 2.5–10 μm [3] |
| Human hair | Approximately 70 μm | EPA scale example, not every hair’s diameter [3] |
| Soil clay fraction | Below 2 μm | USDA mineral-soil size classification [4] |
| Soil silt fraction | Approximately 2–50 μm | USDA classification, not a range for all industrial dust [4] |
| Soil sand fraction | Approximately 50–2000 μm | USDA classification, not every sand product’s measured PSD [4] |
Formal endpoints follow the applicable classification method. These references come from different measurement systems and do not establish one comparable filtration test.
Air-particle behavior is commonly expressed using aerodynamic diameter, which depends on shape and density and may differ from geometric image width. [5] Dust particle size has no single range for all dust: machining, combustion and other sources can produce different distributions. A name such as flour, smoke or dust is insufficient for filter selection.
3. Why measurement methods can give different sizes
Irregular particles have lengths, widths, projected dimensions and equivalent diameters. A fiber’s length or a flake’s maximum length does not alone determine passage through an aperture.
Sieving assesses passage through openings; imaging measures projections; laser diffraction interprets scattering with a model. ISO 13320 describes laser diffraction and its spherical optical-model assumption. Non-spherical samples can give distributions different from sieving or sedimentation without either result automatically being wrong. [6]
Agglomeration and dispersion matter. Preserve dry/wet state, dispersing medium and treatment. Harmonize units while retaining the original size definition.
4. Particle size distribution
An interval distribution gives proportions within bins. A cumulative undersize distribution accumulates below a threshold; an oversize distribution accumulates in the opposite direction. Read boundary conventions and statistical basis.
A steep cumulative curve indicates concentration within a narrower interval; a gradual curve suggests a wider spread, subject to axes and resolution. Multiple peaks are possible. D10, D50 and D90 cannot recover every peak, tail or anomaly: retain the full curve and interval data.
5. D10 D50 D90 and D50 particle size
| Metric | Cumulative undersize meaning | Not equivalent to |
|---|---|---|
| D10 | 10% of the specified basis is below this size | The minimum size |
| D50 | The 50% median on that basis | Every definition of mean, or a filter grade |
| D90 | The 90% percentile on that basis | Maximum size, or 90% filtration efficiency |
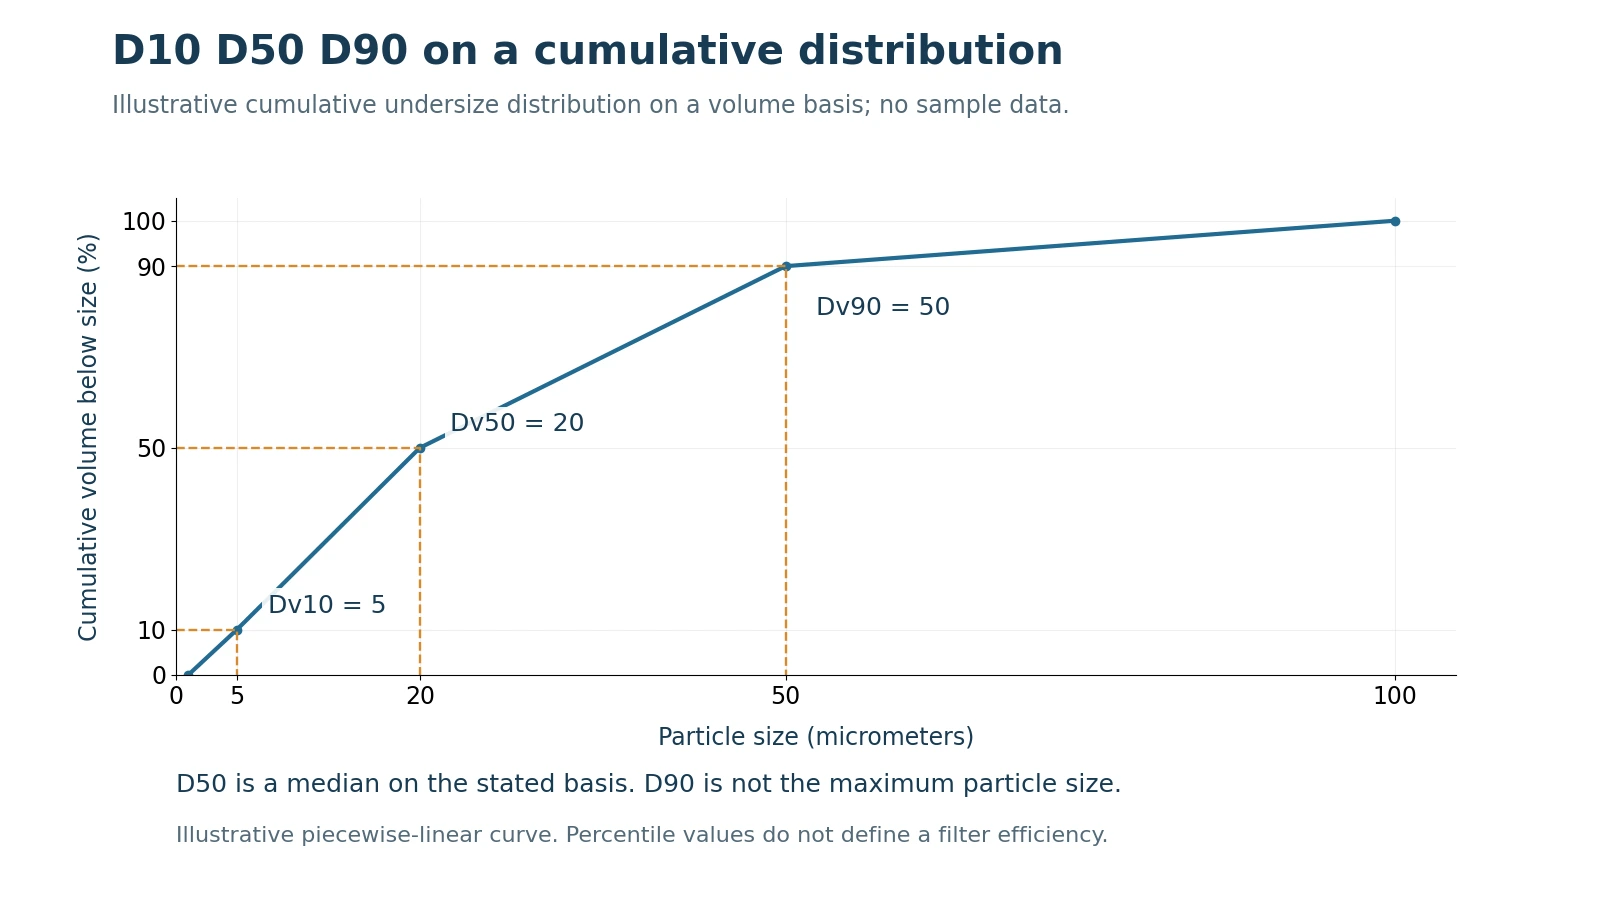
For a volume distribution, D50 = 20 μm locates the 50% cumulative volume position. It cannot be rewritten as 50% of particle counts below 20 μm.
An artificial continuous teaching curve gives Dv10 = 5 μm, Dv50 = 20 μm and Dv90 = 50 μm. Material below Dv10 and above Dv90 remains; these are neither minimum/maximum sizes nor factory measurements.
Span = (D90 − D10) / D50. With that example, span is 2.25. It describes width under a consistent basis, but does not independently prove a single peak, stable dispersion or good filtration. [7] Actual discrete data use the report’s percentile and interpolation conventions.
6. Number vs volume distribution
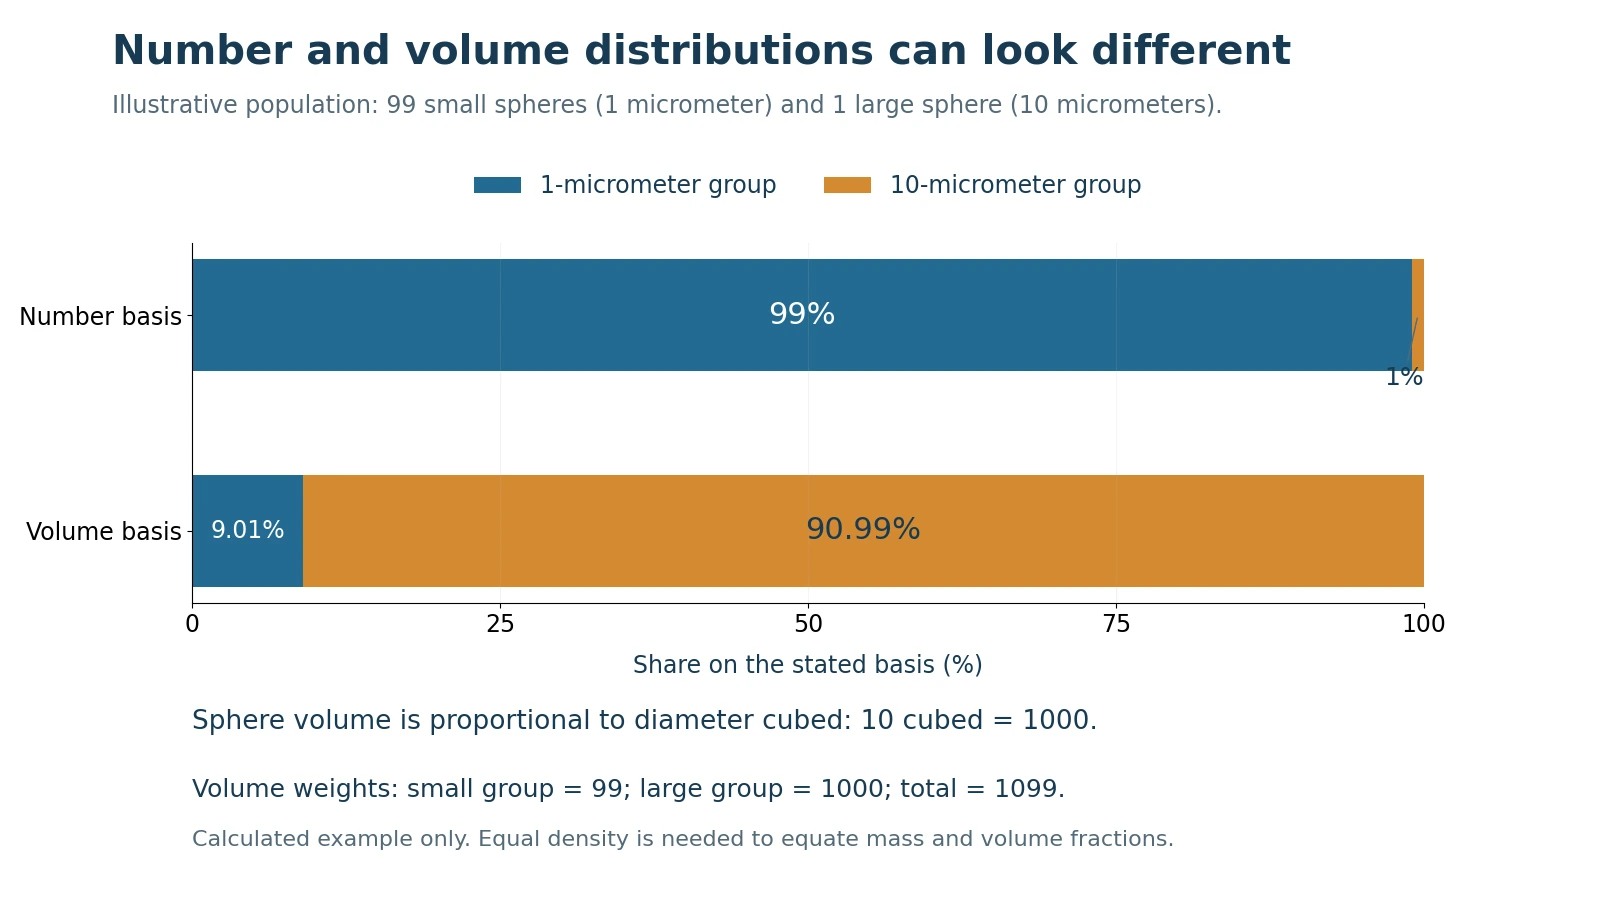
Consider 99 spherical particles of diameter 1 μm and one spherical particle of diameter 10 μm. The count fractions are 99% and 1%. Sphere volume scales with diameter cubed, so the large sphere has 1000 times the volume of a small sphere.
Total volume weights are 99 and 1000. The small-particle group contributes approximately 9.01% of volume, and the single large sphere 90.99%. This is geometry, not an instrument report.
Mass fractions match volume fractions for spheres of the same density. Mixed densities or porous particles need additional information. Converting an actual distribution basis can require shape, density, detection range and model assumptions; merely changing the label from volume to number is invalid.
7. Reading a curve and report
Confirm horizontal units and scale. On a logarithmic axis, equal distances represent equal ratios. Enlarged particle symbols are illustrations, not true printed diameters.
Confirm whether the vertical axis is cumulative fraction, bin fraction or distribution density. The tallest differential peak is not necessarily D50. Record sampling time/location, dispersion, instrument, size definition, statistical basis, range and repeatability or uncertainty.
PSD does not independently provide concentration. Samples with equal D50 can have different particle number or mass concentrations; record concentration separately for loading discussions.
8. Pore size vs particle size in filtration discussions
A contaminant’s D50 of 20 μm does not automatically call for a 20 μm nominal element. Downstream fine-particle limits or a small coarse tail may govern the requirement. Also state removal efficiency, method and operating conditions.
Provide fluid and contaminant source, complete size data, method and basis, critical size range, upstream concentration, flow, temperature, viscosity, pressures, existing medium and cleaning method, and intended sampling/acceptance conditions. Unknown items can remain unknown.
See the filter micron rating and efficiency guide and the wire mesh size calculator.
9. Frequently asked questions
How many millimeters is one micron?
1 μm = 0.001 mm; the conversion does not define the measurement method. ### Does PM2.5 mean every particle is 2.5 μm? It includes a smaller size range within its air-particle category. [3] ### Is PM10 only 2.5–10 μm? No. PM10 generally includes finer particles too. [3] ### Is D50 an average particle size? Describe it as a median on the stated basis; means have their own definitions. ### Is D90 the largest particle? Larger particles can remain in the upper tail. ### Does D90 establish 90% removal efficiency? Distribution and removal are different measurements. ### Do equal D50 values establish equal distributions? Width, peaks and tails can differ; inspect the full data. ### Can size be directly converted to mesh count? An applicable sieve standard or square-mesh wire diameter is needed. Measured particle size is not automatically aperture size.
References
- NPL — Particle size measurement, Good Practice Guide 111.
- NIST — SI prefixes.
- EPA — Particulate Matter Basics.
- USDA NRCS — Soil survey laboratory methods.
- EPA — Aerodynamic equivalent diameter.
- ISO 13320:2020 — Laser diffraction.
- HORIBA — Interpreting particle size distributions.
About the author: Jack Sun has long experience in wire weaving and industrial filter manufacturing. Our company is based in Anping, Hengshui, Hebei, China. Project manufacture and acceptance follow the confirmed drawing, operating conditions and agreed requirements.