Wire mesh pressure drop is the pressure difference needed to drive flow through a mesh or mesh assembly. Open area influences that resistance: at the same flow rate and exposed screen area, a smaller fraction of open space means a higher average velocity through the openings. However, open area alone cannot predict the pressure difference in pascals or bar.
This guide explains the relationship for square-aperture woven cloth and shows what to check before comparing two screens. It separates a simple geometric calculation from a pressure-drop model and from a finished-element test.
1. Calculate square-mesh open area
Open area is the projected fraction of the cloth occupied by clear openings. For an ideal square weave with equal openings and equal wire diameters in both directions, consider one repeating square cell. Its pitch is the clear aperture plus the wire diameter.
Open-area fraction: α = [a / (a + d)]²
Open area (%) = 100 × α
a = clear aperture; d = wire diameter. Use the same length unit for both.
The cell has a total projected area of (a + d)² and an opening area of a². Dividing the latter by the former gives the expression above. This is a geometric calculation, not a flow test or an assessment of particle-retention efficiency.
If the two weaving directions have different dimensions, use the appropriate rectangular relationship, α = [aₓ / (aₓ + dₓ)] × [aᵧ / (aᵧ + dᵧ)], with each aperture and wire dimension taken along the corresponding projected pitch. Check the drawing’s dimension convention before calculating.
Do not transfer the square-opening formula directly to Dutch weave. Dutch cloth has a different three-dimensional pore structure; a visible projected square opening is not its defining filtration passage. Our Dutch weave guide explains that distinction. For square cloth, the mesh count and micron-opening guide explains why count alone is insufficient.

2. Separate face velocity from opening velocity
Always state the area used to define velocity. Two suppliers can report different numerical velocities for the same flow if one uses the exposed cloth area and the other uses only the projected openings.
- Face velocity: Uface = Q / Aexposed, where Aexposed is the gross cloth area exposed to the flow, including the wires but excluding sealed margins.
- Mean projected-opening velocity: Uopen ≈ Q / (α × Aexposed) = Uface / α for a clean, uniformly supplied single screen.
Use α as a fraction, such as 0.40, rather than the number 40. With Q in m³/s and area in m², velocity is in m/s. The opening-velocity calculation is an area average. Local acceleration around crimped wires and nonuniform flow can produce different local velocities.
For gases, specify actual volume flow at the screen’s operating pressure and temperature, or provide a mass flow with the operating density. A normal or standard volume flow must be converted before it is used as actual Q. Where gas-density changes through the screen are significant, a suitable compressible-flow treatment is needed.
3. Compare equal openings with different wire diameters
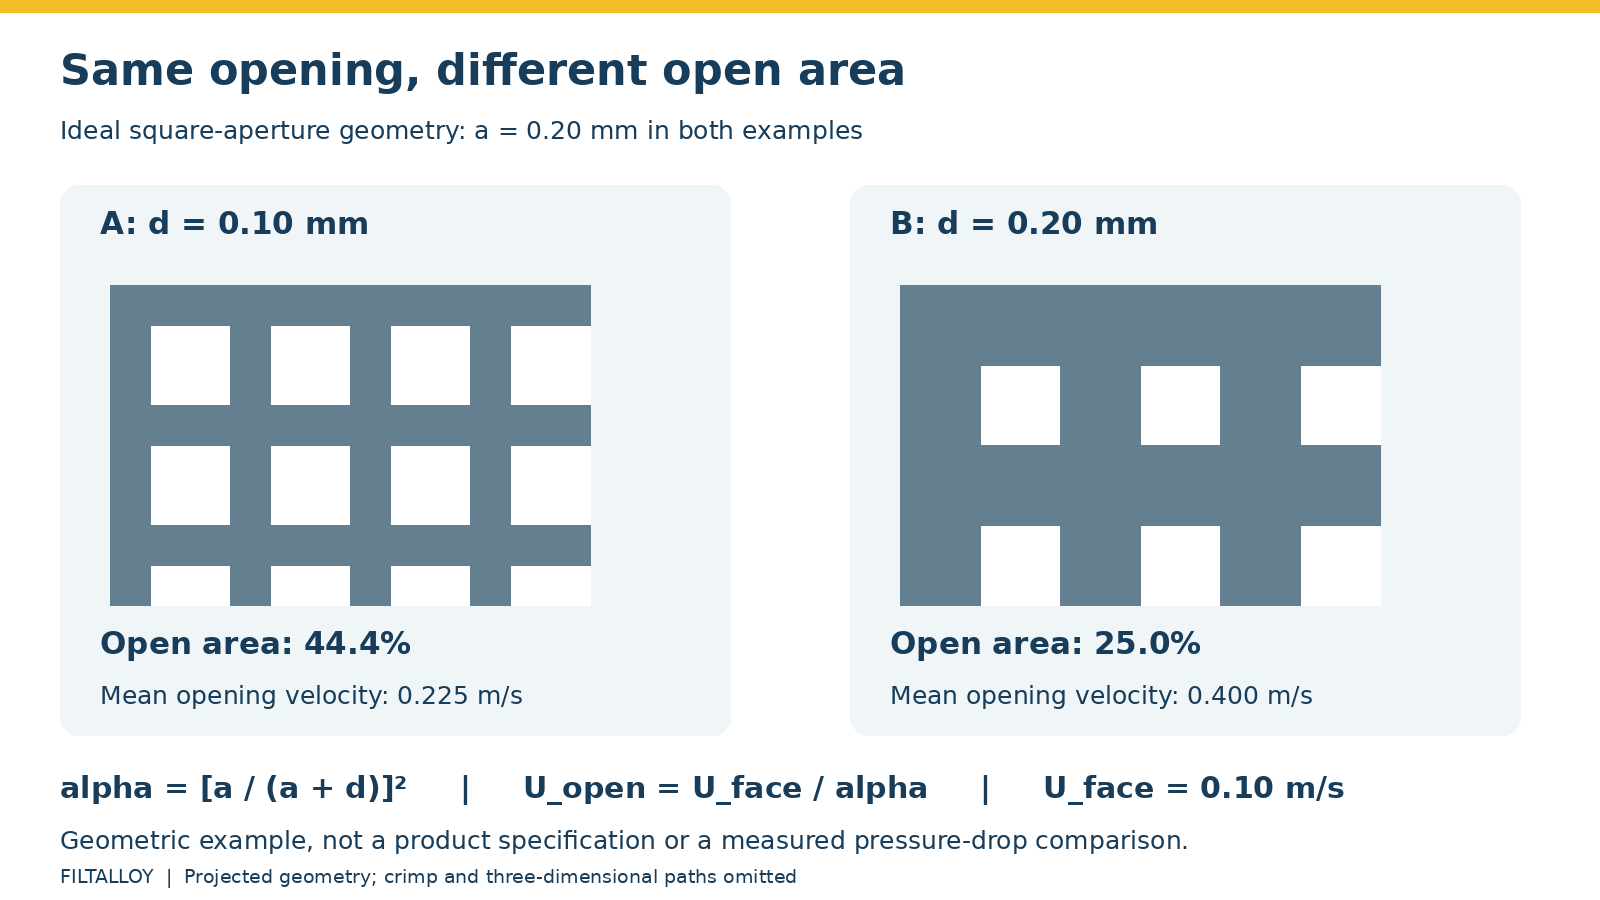
Consider two hypothetical square cloths, both with a 0.20 mm clear aperture. Screen A uses 0.10 mm wire; screen B uses 0.20 mm wire. These are teaching examples, rather than stock specifications or measured performance data.
| Parameter | Screen A | Screen B |
|---|---|---|
| Clear aperture a | 0.20 mm | 0.20 mm |
| Wire diameter d | 0.10 mm | 0.20 mm |
| Pitch a + d | 0.30 mm | 0.40 mm |
| Calculated projected open area | 44.4% | 25.0% |
| Assumed face velocity | 0.10 m/s | 0.10 m/s |
| Mean projected-opening velocity | 0.225 m/s | 0.400 m/s |
At the same exposed area and flow, screen B has less projected open space and a higher mean opening velocity. This explains why ordering only by aperture leaves a major flow variable undefined.
The example does not establish a pressure-drop ratio. Changing wire diameter also changes the flow geometry, characteristic Reynolds number and potentially the appropriate resistance coefficient. Squaring the velocity ratio and calling it the pressure-drop ratio would assume a coefficient that has not been demonstrated to be equal.
Thinner wire can increase open area at a fixed aperture, but the final choice also needs handling, support, fabrication and differential-pressure requirements. Increasing aperture may increase open area too, while changing the particle-screening duty. Neither change should be made solely to achieve a lower calculated restriction.
4. Understand what a pressure-drop coefficient means
A common way to report a screen loss coefficient is:
Δp = K × ρ × Uref² / 2
Δp: pressure difference in Pa; ρ: fluid density in kg/m³; Uref: the defined reference velocity in m/s; K: the coefficient for that velocity definition and applicable conditions.
This expression does not supply K. A coefficient based on face velocity cannot be used unchanged with opening velocity. K can depend on Reynolds number, weave and wire geometry, so this notation does not mean pressure drop always varies with the square of flow over every operating range.
At relatively low Reynolds number, viscous effects can be important; inertial effects become more significant in other conditions. A correlation must match the medium geometry, fluid regime and velocity basis. Obtain the original definition and validity range rather than copying an isolated coefficient from a table.
The NASA report on woven-screen pressure drop under uniform and nonuniform flow includes water tests on square and Dutch-twill cloth and highlights the flow-area basis used for its velocity data. It is useful background, rather than a performance guarantee for a different filter assembly.
For bonded multilayer media and permeability-based calculations, see our separate sintered mesh pressure-drop guide. A single woven screen and a sintered porous medium should not automatically share the same model or coefficients.
5. Check supports, layers and blocked area
Use the filter area calculator to establish geometric area and the net-opening velocity calculator for the square-mesh open-area velocity step. Neither tool predicts total pressure loss. For the manufactured assembly, review our fabricated wire mesh filter elements options.
The cloth’s open-area percentage describes the cloth, not the entire element. A support plate, welded seam, frame, seal or flow-distribution problem can change how much of the medium actually carries flow.
| Condition | What changes | What to check |
|---|---|---|
| Sealed edges and frames | Gross exposed cloth area is smaller than the outside dimensions suggest | Use the active window or active cylindrical length in the area calculation |
| Perforated or mesh supports | Additional resistance and local masking or flow redistribution | Support pattern, spacing, contact and the complete pressure loss |
| Multiple cloth layers | Repeated restrictions, interactions and possible local overlap | Layer order, alignment, contact and assembly test data |
| Pleated construction | Geometric area increases, but narrow passages can restrict its use | Pleat spacing, drainage, support and distribution at the target flow |
| Debris or a deposit layer | Open paths shrink and the deposit adds resistance | Contamination loading, cleaning method and differential-pressure trend |
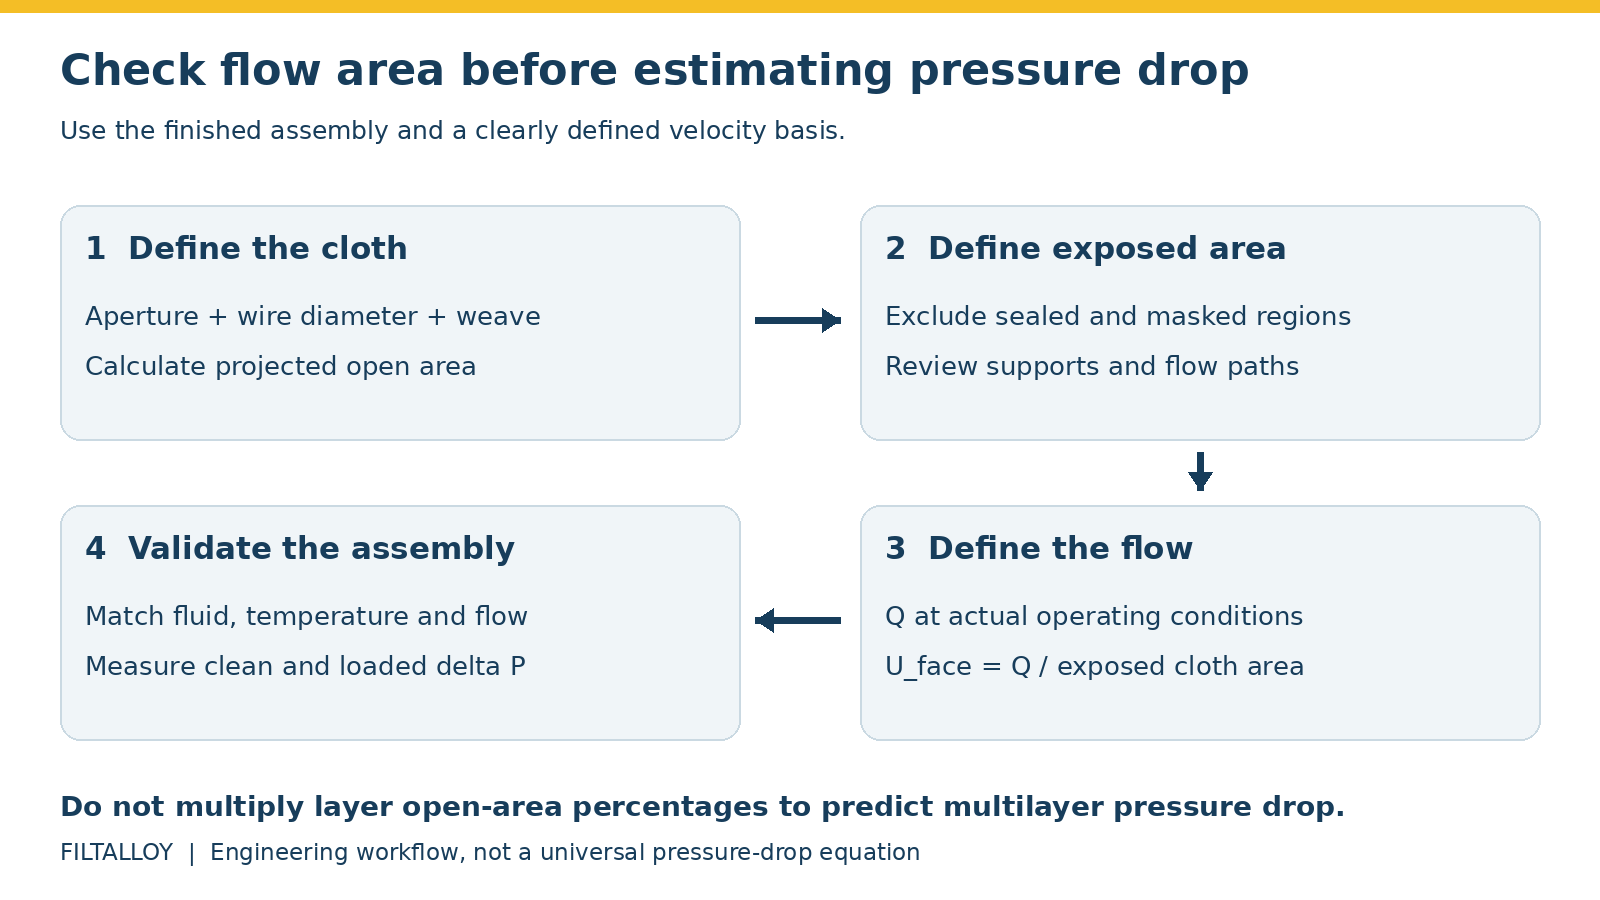
Do not multiply two layers’ open-area percentages and treat the result as a pressure-drop prediction. A projected overlap calculation, where relevant, still does not represent the full flow paths or the losses between layers.
Likewise, a screen with 20% of its openings blocked does not necessarily have a pressure drop 20% higher. The remaining paths carry more flow, blockage may be uneven, and a deposit can add its own resistance. Check trends at comparable flow and fluid temperature. A sudden reduction in differential pressure also needs investigation if bypass, seal failure or screen damage is possible.
6. Specify a useful flow test
For a purchasing or design decision, request data that can be traced to the proposed construction. A clean coupon result is useful, but it does not include every loss in a basket, cartridge or housing.
- Identify the specimen: material, weave, measured wire and aperture dimensions, exposed area, layers, supports and seals.
- Define the fluid: composition, phase, temperature, viscosity and density; give pressure and flow-reference conditions for gas.
- Define the measurements: flow range, pressure-tap positions, pressure-difference convention and any method used to account for fixture losses.
- Record the operating range: several clean flow points are more useful than one unexplained pressure reading. Include relevant cold-start conditions for viscous liquids.
- Address loading and limits separately: agree any contaminant-loading test and the cleaning or replacement criterion. Confirm the element’s allowable differential pressure and the equipment designer’s operating limit.
ISO 9044:2016 addresses industrial square-aperture woven cloth for screening, including dimensional requirements and tests. Its scope is limited for other uses and may require purchaser–supplier agreement. It does not provide a universal pressure-drop rating for a finished filter.
When preparing a specification, send the drawing, fluid conditions, target flow and pressure-loss budget alongside the mesh details. Our wire mesh specification guide provides the broader checklist. That combination gives a manufacturer a clearer basis for reviewing the cloth and support construction.
Frequently asked questions
Does higher open area always mean lower pressure drop?
For otherwise comparable clean screens at the same face velocity and fluid conditions, higher open area generally reduces restriction. Across different weaves, supports or assemblies, compare a suitable model or test result rather than open area alone.
Can I calculate pressure drop from mesh count?
No. Count alone does not establish aperture or open area, and even a complete geometric specification still needs fluid conditions, velocity and an applicable pressure-loss relationship.
Is 40% open area the same as 40% porosity?
Not necessarily. Projected open area is a two-dimensional area ratio. Porosity is usually a void-volume fraction of a three-dimensional medium. Check how each term is defined in the document you are using.
Should I choose the highest possible open area?
Choose the required aperture and verify strength, support, fabrication and flow performance together. A high open-area number does not establish retention efficiency, service life or a safe differential-pressure limit.